This fall, Congress will likely consider an energy permitting bill modeled on the SPEED Act that the House passed last December. The 53 Republican Senators hope to recruit seven Democrats or independents to pass the bill with a filibuster-proof 60-vote supermajority, making it very difficult to later revise or repeal. The bill’s sponsors will likely wait to begin negotiations in earnest until after the midterms, when Democrats and independents – particularly those who are leaving office – may be more willing to cast contentious or unpopular votes.
If passed, the bill would likely accelerate buildout of all forms of energy infrastructure. To provide a net benefit to public health or the climate, a permitting bill would need to accelerate buildout of clean energy infrastructure more than it accelerated buildout of fossil fuel infrastructure. When considering whether to support the bill, it’s therefore important to understand what kinds of energy infrastructure people are trying to build.
I’ll focus here on the electricity sector. The electricity sector is a relatively small subset of the larger energy permitting conversation – electricity contributes only 18% of United States final energy – but it’s also where essentially all the exciting developments in clean energy are happening today.

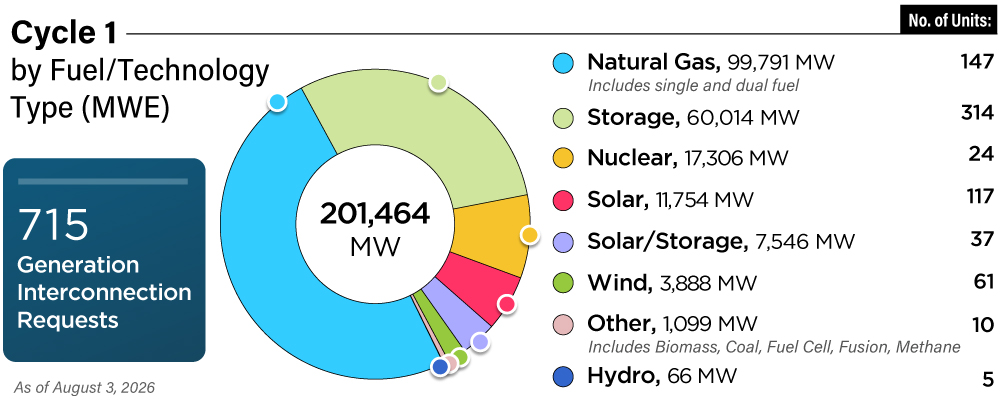
A recent data point for the electricity sector comes from PJM, the nonprofit that operates the Mid-Atlantic electricity transmission system. PJM just updated its interconnection queue to remove redundant and speculative capacity offers, which plague other grid operators’ queues. (In the electricity sector, “capacity” means the technical capability to generate electricity.) The updated, filtered queue includes 200 GW of new capacity, enough to double PJM’s current capacity and increase total United States capacity by 15%.
As illustrated below, PJM’s 200 GW interconnection queue includes 100 GW of gas capacity, 60 of batteries, 19 of solar, 17 of nuclear, and four of wind. By capacity, the generation in PJM’s interconnection queue is 71% gas. PJM’s queue has 2.5 times more gas capacity than clean (nuclear plus renewable) capacity and 4.3 times more gas capacity than renewable capacity.
How much electrical energy a power plant generates depends not only on its capacity, but also on how often and hard it runs. Assuming a typical capacity factor1 for each class of generator, PJM’s queue would generate about 698 TWh per year. Of that 698 TWh, about 507 (72.6%) would come from gas, 138 (19.8%) from nuclear, 41 (5.9%) from solar, and 12 (1.7%) from wind.
In 2025, PJM electrical energy was 61% fossil-fueled: 44% gas, 17% coal. If all generation in PJM’s interconnection queue were built – roughly doubling the size of PJM’s system – the fossil-fuel share of PJM electrical energy would increase from 61% to 67%. In other words, a permitting bill that equally accelerated all forms of generation in PJM’s interconnection queue would substantially increase the fossil share of PJM generation.
If all clean generation in PJM’s queue were built, but today’s 61% fossil share of total PJM generation were maintained, then only 60% of the gas in PJM’s queue could be built. In other words, to avoid increasing the fossil share of PJM energy, a permitting bill would have to green-light all queued clean generation while blocking 40% of queued gas generation. (Calculations here.) To actually decrease the fossil share of PJM energy, more than 40% of queued gas generation would need to be blocked.
The calculations above only included electricity. Even within that narrow scope, it’s not at all clear that a federal energy permitting bill would help clean energy more than fossil fuels.
Of course, a permitting bill would also likely accelerate energy infrastructure buildout to serve other sectors, such as transportation and industry, where fossil fuels overwhelmingly dominate. These sectors comprise 82% of United States final energy, compared to electricity’s 18%. In order to decrease the fossil share of total final energy, clean electricity would need to not only outpace fossil electricity – already a dubious prospect – but to outpace fossil electricity sufficiently to make up for fossil energy acceleration in other sectors.
- A capacity factor is the ratio of a generator’s annual energy output to its maximum possible annual energy output. For these calculations, I used the 2025 United States average capacity factors for natural gas combined-cycle (58%), solar photovoltaics (24%), nuclear (91%), and wind (34%). Here are the gas and non-gas data sources.
As far as I know, PJM hasn’t released a breakdown of combined- vs. simple-cycle gas capacity in its interconnection queue, but a nontrivial share is likely simple-cycle. Historically, inefficient simple-cycle gas turbines have run at low capacity factors (2025 United States average: 14%), mainly to meet electricity demand peaks. However, I’m not sure the past is a good indicator of how simple-cycle gas turbines will run in a future PJM where demand growth comes almost entirely from data centers that develop large language models such as ChatGPT, Claude, and Gemini. The xAI data center in Memphis, for example, runs mainly on simple-cycle gas turbines. ↩︎