Thermal modeling for buildings

This is the tenth live-blog of my spring 2026 DERs class.

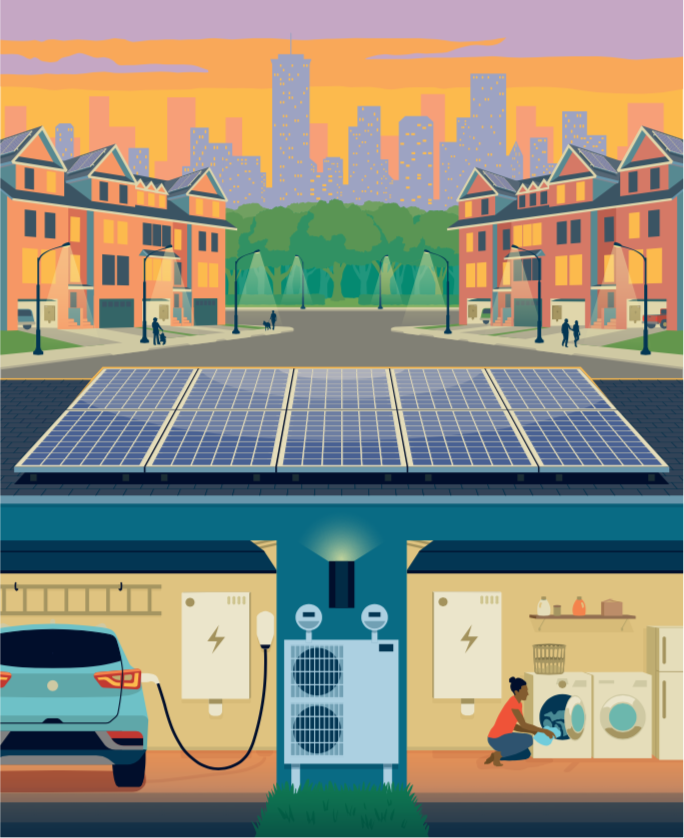
The last post introduced buildings from an energy perspective and discussed why a DER student might want to learn about them. This post discusses how we model the thermal dynamics of buildings using (surprise!) linear ordinary differential equations.

As discussed in the last post, almost all thermal equipment in buildings has some flexibility in the timing of its electricity use. That flexibility can be used to shift energy use away from times when electricity prices are high, when electricity generation is dirty, or when electrical infrastructure is strained.

To understand how much flexibility thermal equipment has, and how to use it, it helps to understand how indoor temperatures evolve and the role thermal equipment plays in that evolution.

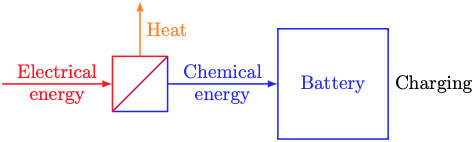
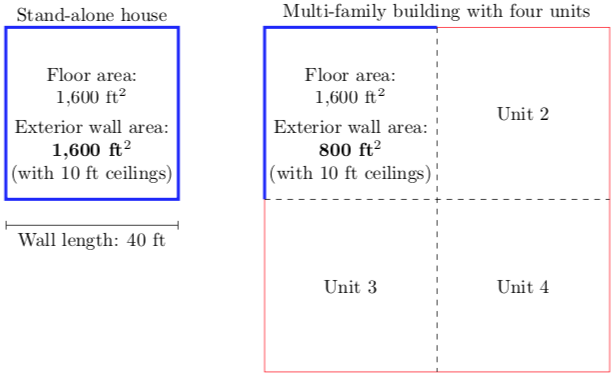
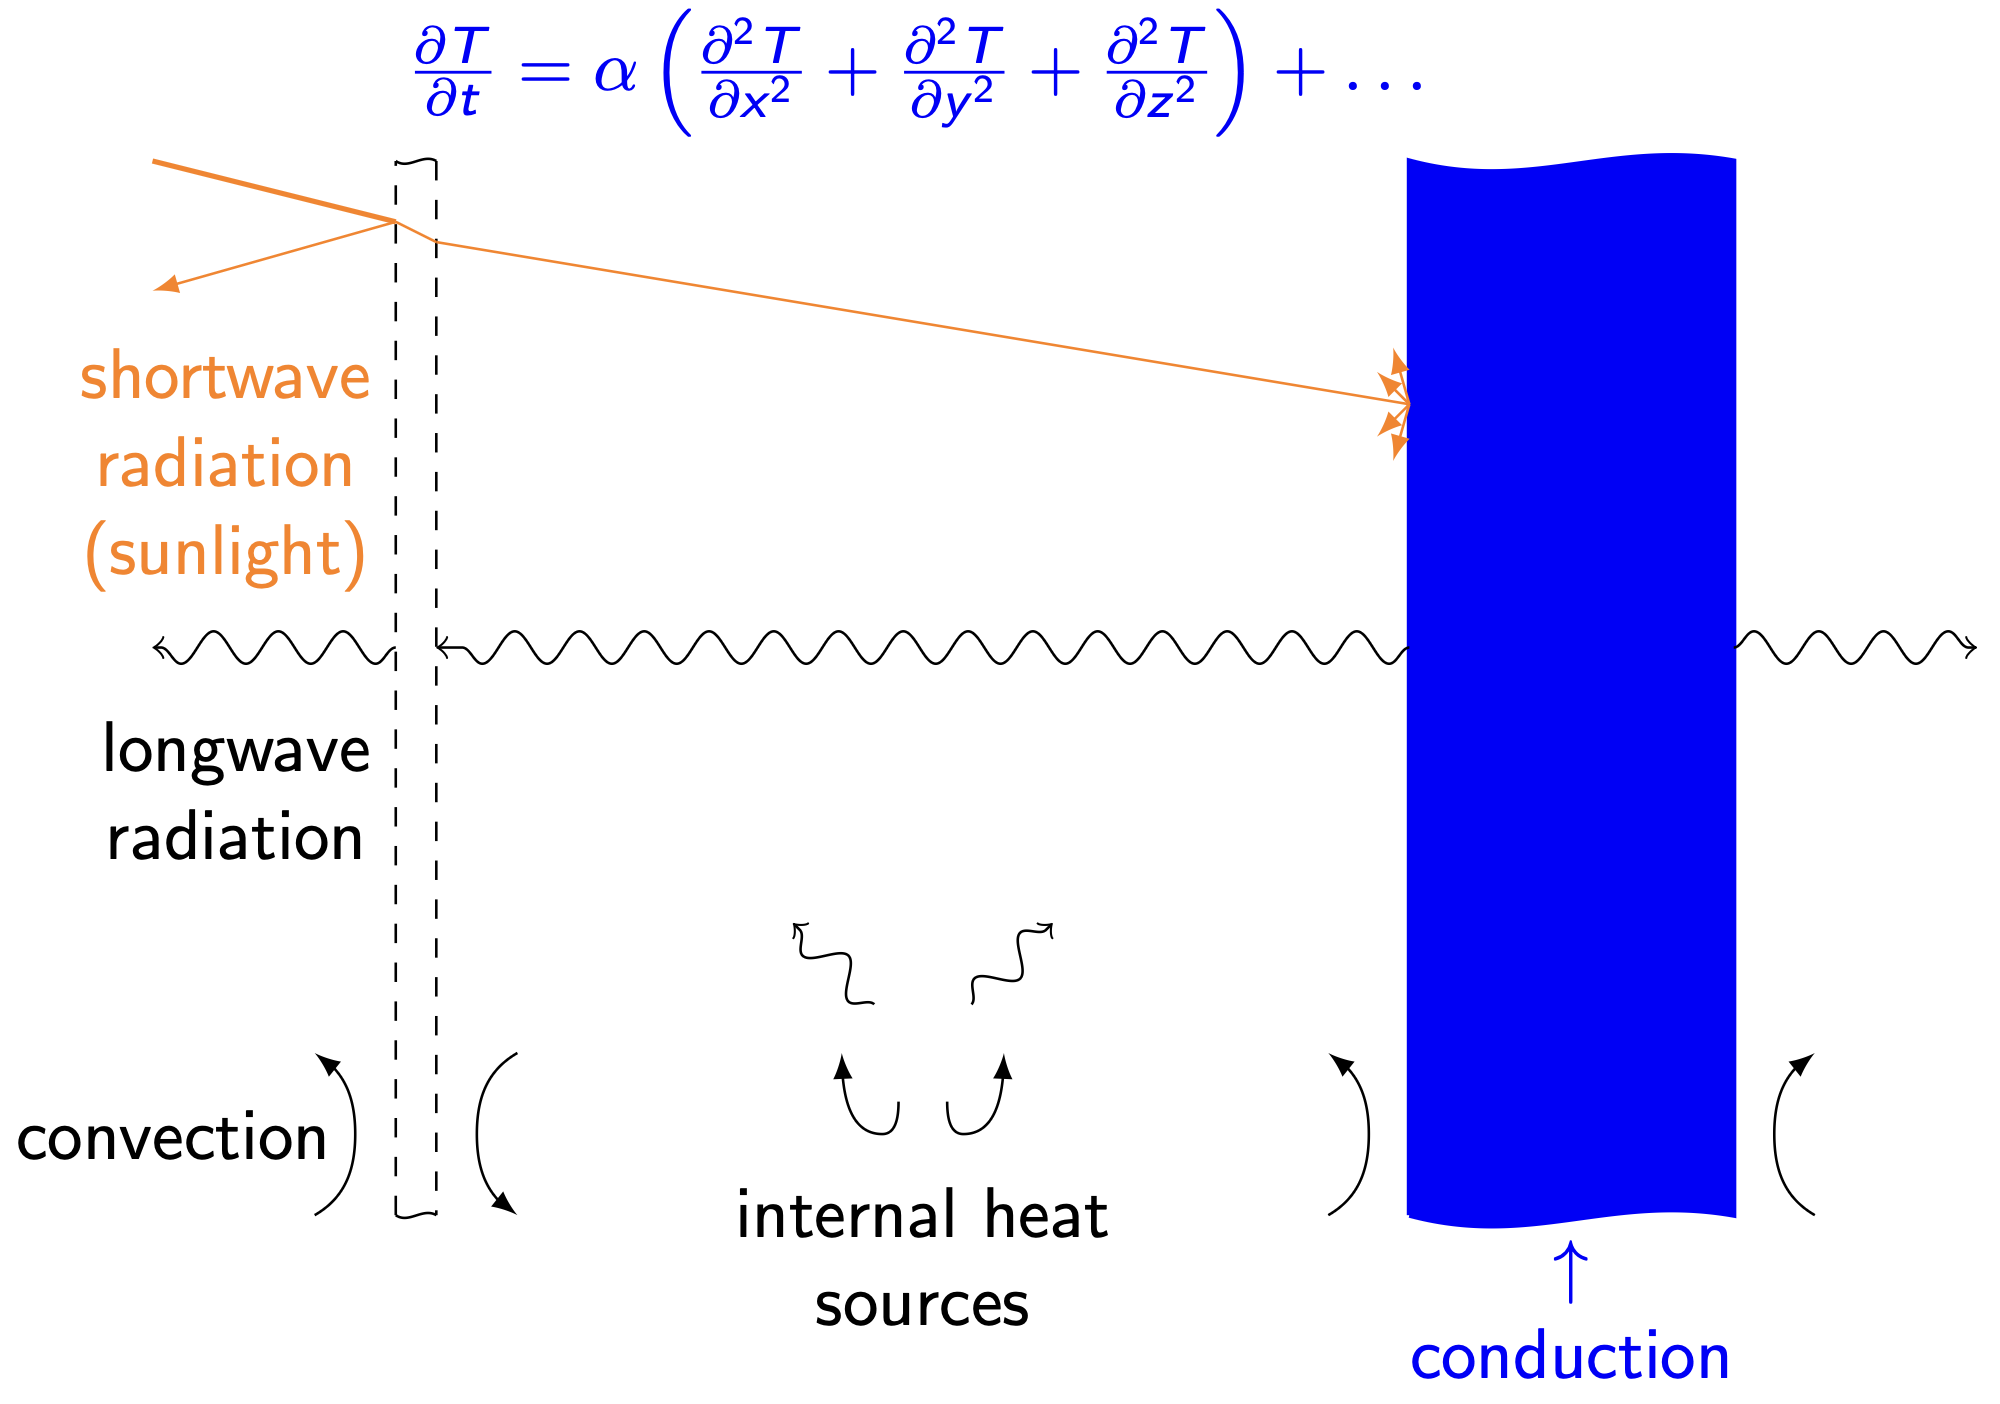
Detailed modeling of indoor temperature dynamics is hard. A “true” model (sketched below for a very simple building geometry) would keep track of continuous temperature distributions within the indoor air, walls, windows, roof, and foundation. It would account for conduction and air infiltration through the building fabric, for shortwave radiation from lights and the sun, for longwave radiation exchange between surfaces, for convective heat transfer between solids and fluids, and for all heat transfer driven by occupants and their devices. The model structure would be a set of coupled, nonlinear partial differential equations whose solution we could only hope to approximate using computationally intensive numerical solvers.

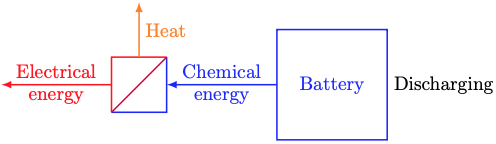
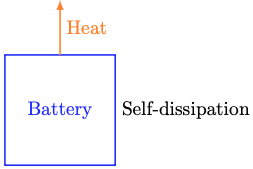
Thankfully, there’s a much simpler modeling approach that captures the dominant physics that drive indoor temperature dynamics. That approach is called thermal circuit modeling. It describes temperature dynamics by analogy to (direct current) electrical circuits. In that analogy, temperature plays the role of voltage and heat1 plays the role of charge. Resistors are things that impede the flow of heat. Capacitors are things that store heat.

The figure below shows a thermal circuit with one resistor and one capacitor.

The state of this thermal circuit is the indoor temperature at time t, T(t). The outdoor temperature θ(t) plays the role of a driving voltage. The heat flows qc(t) and qe(t) act as current sources. They come from controlled thermal equipment and exogenous sources (sunlight, body heat, etc.), respectively.

The 1R1C circuit’s governing equation is a first-order linear ODE. It can be derived by applying Kirchhoff’s Current Law at the node labeled T(t) and Ohm’s Law for the temperature (voltage) drop across the resistor. With the ODE in hand, we can apply the usual time-discretization scheme to produce an algebraic equation that can be programmed in a computer to simulate the indoor temperature’s dynamic response to changing outdoor temperatures and other boundary conditions.

The 1R1C model parameters and boundary conditions can be specified in a few ways. They can be found from first principles given information about the building geometry and material properties. They can be fit to monthly utility bills and weather statistics. They can be fit to time-series data from a smart thermostat. Each of these approaches has its challenges and merits. That the latter two approaches work at all is a happy consequence of the 1R1C model’s very simple structure. Fitting more complex, nonlinear building thermal models to data from utility bills or smart thermostats is much harder.

Higher-order thermal circuit models can represent a wider range of behavior than 1R1C models. They can represent large buildings with thermal coupling between rooms or floors. They can represent the deep thermal mass of concrete, wood, and other dense building materials. Higher-order models can be formed and discretized like 1R1C models.


  1. For the nitpickers, yes, technically heat isn’t really a thing. Scientists used to think heat was an intangible, invisible fluid that flowed from hot things into nearby cold things. It’s not. Heat is just a way to transfer energy, like work (exerting a force over a distance). That’s the definition of heat: Energy transfer that’s not work. Alternatively and equivalently, heat is energy transfer driven only by temperature differences.

Buildings and thermal equipment

This is the ninth live-blog of my spring 2026 DERs class.

The last post talked about solar energy. This post discusses why we might care about buildings in general and their thermal equipment in particular. The next post will introduce thermal modeling techniques for buildings.

When people in the energy world say “buildings,” we generally mean all structures other than industrial facilities. We subdivide the buildings sector into residential (detached single-family houses, small apartment buildings, condos, row houses, etc.) and commercial (offices, shops, bars, restaurants, hotels, schools, hospitals, etc.).

For whatever reason, we categorize big apartment buildings — a skyscraper with hundreds of apartments, for example — as commercial, even though they’re full of residences. Similarly, we lump factories into the industry sector, even though they’re buildings used for commercial purposes. Energy nerds are weird.

Why might a DERs student care about buildings? Well, buildings host most of the DERs we cover: The heating and cooling equipment that keeps buildings comfortable, the solar photovoltaics on their roofs, the electric vehicles in their garages and parking lots, the water heaters and tanks in their basements and mechanical rooms, and so on.

Americans also spend some 90% of our time indoors. The indoor environments we inhabit — how they look, feel, and sound; the quality of the indoor air we breathe — strongly influence our health and happiness.

Buildings use three-quarters of United States electricity (industrial structures — technically not buildings to energy nerds! — use the other one-quarter) and emit one-third of United States climate pollution.

Americans spend some $400 billion per year on utility bills for residential (~$250 billion) and commercial (~$150 billion) buildings. For context, only eight companies in the world take in more than $400 billion per year in gross revenue.

Within the United States buildings sector, thermal equipment — furnaces, boilers, air conditioners, refrigerators, compressors, pumps, fans, etc. — uses two-thirds of the energy and half the electricity. I show this in the chart below, which I assembled from various Energy Information Administration datasets.

In addition to using ~35% of United States electricity, emitting ~22% of United States climate pollution, and costing Americans ~$250 billion per year in utility bills, thermal equipment in buildings almost always has some degree of flexibility in the timing of its energy use. This flexibility is a vast, and largely untapped, resource. We’ll talk about how to use that resource to improve the efficiency, reliability, and affordability of electricity systems. The next post starts that conversation with an overview of modeling buildings’ thermal dynamics.

A miasma of incandescent plasma

This is the eighth live-blog of my spring 2026 DERs class.

The last two posts discussed modeling DERs using linear ordinary differential equations and applied that modeling approach to batteries, the canonical DER. This post focuses on the one big DER we’ll study this semester that we won’t model with differential equations: Solar energy.

As They Might Be Giants explained in 1993, the sun is a mass of incandescent gas.

Well, actually… No. Technically, a gas consists of neutrally-charged atoms or molecules, stuff with the same number of protons as electrons. The sun consists of charged stuff — mainly hydrogen and helium nuclei — making the sun a miasma of incandescent plasma, as They Might Be Giants correctly re-explained in 2009.

Ah, technically correct. The best kind of correct.

Anyway, the sun is a giant nuclear fusion reactor that mashes hydrogen nuclei into helium nuclei, releasing lots of energy. That energy propagates through space as electromagnetic waves — and/or as photons, if you’re into the whole wave/particle duality thing — which we perceive on earth as sunlight.

Sunlight is the underlying source of almost all flavors of energy that humans use on earth. This obviously includes electricity from solar photovoltaics and solar thermal power, but also hydropower (via the water cycle), wind power (driven by temperature differences, largely due to different amounts of sunlight hitting the equator and the poles), heat and power from biomass (via photosynthesis) and, indirectly, from fossil fuels (via biomass rotting and pressure-cooking underground for a few million years).

Nuclear power is one exception. All nuclear power plants on earth today use fission: Splitting heavy atoms into lighter atoms, releasing lots of energy. Although the sun itself is a giant nuclear fusion reactor, it is not the source of the heavy atoms that humans split on earth for nuclear fission power. Those can mostly be traced back to ancient stars that exploded when they died. Suns, but not our sun. Nuclear power plants generate about 19% of US electricity.

Geothermal power is another exception. It involves extracting energy from hot underground rocks, usually by piping cool water over them to get back hot water or steam. What makes those rocks hot? Mainly nuclear fission reactions deep underground. Geothermal power plays a small (0.4% of electricity generation), but potentially growing, role in our energy systems.

The third exception is tidal power, extracting kinetic energy from tides driven by gravitational interactions between the oceans and the moon. Tidal power today is mostly limited to small research and demonstration projects.

What does all this have to do with DERs? Not much, but I think it’s pretty cool.

Back to the sun: After beaming through space at the speed of light for eight minutes and twenty seconds, around 1.36 kW/m2 of sunlight hits earth’s upper atmosphere. That number is called the solar constant. It showed up in the simple climate model in the lecture slides on linear dynamical systems.

The amount of sunlight that reaches a square meter of earth’s surface (known as solar irradiance) is less than the solar constant. It’s highest on clear days and lowest on cloudy days. In most locations, solar irradiance peaks at about 1 kW/m2 on clear summer days.

Thanks to astronomers’ adventures in spherical geometry, we have extremely accurate formulas for the sun’s position in the sky at any moment of any day of any season, as viewed from any place on earth. Given a local weather forecast, these formulas let us predict the solar irradiance incident on any arbitrarily oriented surface. That lets us predict useful things such as solar photovoltaic power output and heat gains from sunshine through windows (the key to passive solar building design). Those formulas are the main topic of the lecture on solar energy.

More battery modeling

This is the seventh live-blog of my spring 2026 DERs class.

The last post introduced linear ordinary differential equations as a tool for DER modeling. Instead of leading with the general theory, as the lectures do, the last post led with a DER we’re all familiar with: The humble battery. It turns out that learning to model batteries teaches us almost everything we need to know to model a wide variety of other DERs, such as space heating and cooling systems, water heaters, thermal storage, and others.

This post will talk a bit more about batteries. Specifically lithium-ion batteries, which power almost all laptops, phones, and e-mobility, from wheelchairs to semi trucks. Lithium-ion batteries have high energy densities, charge and discharge quickly, and last a long time. Oh, and they’re now dirt cheap.

Image credit: Rocky Mountain Institute

I’m not a chemist, so I’ll skip writing about how batteries work and refer interested readers to this nice article from the Australian Academy of Science. I also won’t write again about modeling how the energy stored in a battery evolves over time; the last post did that. Instead, I’ll focus on how to model energy conversion losses when charging or discharging. I’ll also talk a bit about how to pick reasonable values for the parameters in battery models.

Devices that convert energy from one form to another generally lose some energy as waste heat. An electric motor, for example, might turn 90 percent or so of the electrical energy it draws from the power grid into rotational kinetic energy; the other 10 percent dissipates to the surroundings via heat transfer as friction and electric resistance heat up parts of the motor. Similarly, a battery might lose five percent or so of the input electrical energy when it charges and another five percent or so when it discharges. As shown below, the battery’s charging (blue) and discharging (orange) efficiencies determine the energy conversion losses.

Along with the charging and discharging efficiencies, one more parameter governs a battery’s energy losses: The self-dissipation time constant. As discussed last time, self-dissipation is the slow, passive loss of energy to the surroundings that happens even when a battery is unplugged and unused. Self-dissipation is what drains a battery forgotten in a junk drawer. As with the charging and discharging efficiencies, higher values of the self-dissipation time constant are better. The figure below shows how an unused battery’s stored energy decreases with time. After three time constants, about 95% of the initial energy has been dissipated as heat. A typical lithium-ion battery has a time constant on the order of 1,000 hours.

Three more parameters are needed to fully define our battery model: The energy capacity (in kWh) and the charging and discharging power capacities (in kW). These are all design parameters that are typically determined by the application. For most lithium-ion batteries, the energy capacity is two to four hours times the charging power capacity. For stationary batteries, the discharging power capacity is typically similar to the charging power capacity. For electric vehicle batteries, the discharging power while traveling is, for all intents and purposes, unlimited. When you floor it in an electric car — to go from zero to 60 miles per hour in under two seconds, say — the battery discharges at over 500 kW. For context, Level 1 electric vehicle charging is around 2 kW. Level 2 is around 10 to 12 kW.

Modeling DERs

This is the sixth live-blog of my spring 2026 DERs class.

The last few posts discussed what Distributed Energy Resources (DERs) are and why someone might want to learn about them. This post marks a shift from the first, introductory section of the class — on definitions, motivations, and context (social, political, economic) — to the second, more technical section on DER modeling and simulation.

Mathematical modeling helps us understand how DERs work, how to design and size DER systems, and how to operate DERs to reduce energy costs, pollution, and strain on electrical infrastructure. Simulation just means running a mathematical model on a computer.

For any given DER, detailed modeling that captures all of its subtle physical effects is hard. Fortunately, one simple modeling approach captures the dominant physics of almost all of the DERs we’ll study this semester: Batteries, electric vehicles, space heating and cooling systems, water heaters, and thermal storage. That simple, broadly applicable approach is to model DER dynamics using first-order linear ordinary differential equations.

“First-order linear ordinary differential equations” is a mouthful. The lectures define each of those words precisely, with examples. To avoid getting bogged down in math, this post will just introduce the canonical DER example — a battery — which (perhaps surprisingly) ends up being almost all we need.

We’re all familiar with batteries from our personal electronics. Batteries take in electrical energy, convert it to chemical energy, store it, and convert it back to electrical energy later.

As shown above, converting between electrical and chemical energy always entails some heat loss to the battery’s surroundings. You can feel the heat if you touch your phone or laptop while it’s charging.

Next week, we’ll learn a bit about electrochemistry and model energy conversion losses. For now, we’ll just model the chemical energy dynamics (the blue stuff in the sketches above). The simplest model of a battery’s chemical energy dynamics is

Rate of change of stored energy = Charging power.

When the righthand side is positive, the battery is charging and the stored energy increases. When the righthand side is negative, the battery is discharging and the stored energy decreases.

This is about the simplest imaginable example of a first-order linear ordinary differential equation. The variable is the stored energy, a function of time. The equation is differential because it involves the derivative (rate of change) of the stored energy. It’s ordinary because the stored energy is a function of one scalar variable (time), rather than multiple variables. It’s first-order because the first derivative is the highest derivative in the equation. It’s linear because it doesn’t involve any nonlinear functions (powers, roots, sinusoids, exponentials, etc.) of the stored energy or its derivatives.

Given an initial stored energy E(0) and the charging power p(t) at each time t > 0, solving the differential equation (or more precisely, the initial value problem) means finding a function E that takes any t > 0 and returns the stored energy E(t). In this very simple example, the solution is

E(t) = E(0) + Integral of p from 0 to t.

(This formula comes from integrating both sides of dE(t)/dt = p(t) and applying the fundamental theorem of calculus.) If p is constant, then E(t) = E(0) + pt, which looks like constant-velocity motion from high school physics.

This model does not quite satisfy conservation of energy. To see why, suppose the charging power is zero: No charging, no deliberate discharging. In this case, the model predicts E(t) = E(0) for all t. Constant stored energy, forever. This contradicts our physical experience. If I fully charge a AA battery, then toss it in a junk drawer and forget about it for a year, will it still be fully charged? No, it will be dead. This means the model is missing an energy flow.

The missing energy flow is called self-dissipation: The slow, passive loss of stored chemical energy as heat dissipation to the battery’s surroundings. Self-dissipation happens even when the battery is not being actively charged or discharged.

It turns out that self-dissipation happens faster if the battery is closer to fully charged. You can convince yourself of this through a simple (if very slow) experiment. Fully charge an old electronic device, then unplug it and turn it off. Every day around the same time, turn it on, record its state of charge, and turn it off again. I bet you’ll find that the energy lost from one day to the next gets smaller as the days go by.

This observation motivates modeling self-dissipation as

Self-dissipation = Stored energy / Time constant.

The time constant, in units of hours, tells us how long it takes to lose a given amount of energy. Batteries with longer time constants have slower self-dissipation. After three time constants, the battery loses about 95% of its initial stored energy. Lithium-ion batteries — the dominant battery technology for almost all applications today — typically have time constants on the order of a thousand hours.

Adding self-dissipation to our battery model gives

Rate of change of stored energy = Charging power – Stored energy / Time constant.

Now the variable (the stored energy) shows up both directly on the righthand side and indirectly on the lefthand side via its derivative. The equation is still differential, ordinary, first-order, and linear. Some math shows that if the charging power p is constant, then the solution E(t) is a mixture of the initial state E(0) and a final value E(∞) that the stored energy asymptotically approaches but never reaches. The final value is the product of the charging power and the time constant. As time goes on1, the mixture contains more of E(∞) and less of E(0).

The battery model is canonical: It tells us almost everything we need to know about the essential dynamics of batteries, electric vehicles, space heating and cooling systems, water heaters, thermal storage, and other DERs. The battery model is so broadly applicable because it captures the essential behavior of energy storage. Although it might not be obvious now, we will see that all of the DERs mentioned above store some form of energy. Modeling these DERs using first-order linear ordinary differential equations will make the analogy to batteries clear.

The battery model is scalar: It summarizes the state of the battery by a single number. Sometimes, one number is not enough to summarize the state of a DER system. We’ll model those cases using vector first-order linear ordinary differential equations. These work about like the scalar version, but are much more powerful because they can model arbitrarily large, interconnected systems. The enabling math is called linear algebra. We’ll spend some time on it because it’s useful for DERs, but also for an incredibly wide range of computational applications that spans almost every technical field.


  1. More specifically, in the weighted average at time t, the weight on E(0) is the exponential of -t divided by the time constant. The weight on E(∞) is one minus the weight on E(0).

Why DERs? Part 3: Climate

This is the fifth live-blog of my spring 2026 DERs class.

I think there are three main reasons to study Distributed Energy Resources (DERs): Health, money, and climate. The last two posts focused on health and money. This post will focus on climate.

Humans have changed the climate. The US, for example, is seeing increasingly frequent and severe droughts, floods, wildfires, extreme storms, and other weather and climate disasters. The graph below shows that the number of billion-dollar weather and climate disasters (inflation-adjusted to 2025 dollars) per year has risen steadily since 2005. Over the last ten years, US billion-dollar weather and climate disasters have cost $1.5 trillion and killed 6,500 people. Recent advances in attribution science show that climate change is contributing to the increasing frequency and severity of these disasters.

Image credit: Climate Central

Due in large part to recent advances in clean energy technologies and costs, a parallel two-path strategy based on existing, economically competitive technologies can now reduce global climate pollution by two-thirds or more. The first path is to clean up the power grid by replacing fossil-fueled power plants with clean generation (~25% of US climate pollution). The second, parallel path is to switch heating (~25%) and driving (~16%) from fossil fuels to electricity.

DERs feature prominently in that two-path strategy. As the last post discussed, solar photovoltaics are now the fastest-growing electricity source. Distributed solar economics only get better as utilities raise retail electricity prices. Electric heat pumps can replace fossil fuels for space heating, water heating, and low- and medium-temperature industrial processes. Electric resistance heat and thermal storage can replace fossil fuels for many high-temperature industrial processes. Electric skateboards, bikes, scooters, buses, trains, cars, and trucks can replace light- and medium-duty fossil-fueled vehicles.

Cleaning up the grid and electrifying everything we can won’t eliminate all climate pollution. We need to work in parallel on reducing energy demand, on agriculture, on deforestation, on many other things.

But there’s a whole lot of proven, cost-effective action we can take today. DERs feature prominently in that action and bring additional health and affordability benefits.

Why DERs? Part 2: Money

This is the fourth live-blog of my spring 2026 DERs class.

I think there are three main reasons to study Distributed Energy Resources (DERs): Health, money, and climate. The last post focused on health. This post will focus on money.

DERs present vast business opportunities. Worldwide, people pay other people some $10 trillion for energy each year. That’s about 9% of global annual GDP1. About 80% of energy expenditures are for fossil fuels. DERs alone won’t displace all of that fossil fuel use, but displacing even a modest 15% is a trillion-dollar-per-year opportunity.

DERs are already economically attractive in many settings and are getting more attractive each year. Lithium ion battery prices, for example, fell by 86% from 2013 to 2024. Solar photovoltaic panel prices2 fell by 87% from 2011 to 2024. Solar panels now cost less per unit area than siding, roofing shingles, or fence pickets. These price declines are examples of the “learning by doing” effect: For many clean energy technologies, prices drop by 10-20% with each doubling of manufacturing capacity. Manufacturing capacity for many DERs has doubled many times in the last decade, driven overwhelmingly by China.

Due in part to these price declines, adoption of clean energy technologies is accelerating. US battery capacity installations reached 11 GW in 2024, up from 0.25 GW in 2019 (4,400% growth in five years). Electric vehicles reached 7% of US vehicle sales in 2023, up from 2% in 2019 (350% growth in five years). Solar photovoltaics reached 67% of US electricity generation capacity installations in 2024, up from 34% in 2019 (197% growth in five years). Electric heat pump sales outpaced natural gas furnaces in 2022 at 4.3 million units, up from 2.6 million in 2017 (165% growth in five years). These growth rates are unheard-of in most industries.

DERs can make life more affordable. The graph below, made by Karin Kirk at Yale Climate Connections, shows the rise in retail electricity prices since 1997 by year and by economic sector. Residential electricity prices have risen sharply since 2021, both in absolute terms and compared to commercial and industrial electricity prices.

Image and analysis credit: Karin Kirk for Yale Climate Connections

DERs can lower electricity bills in two ways. First, households can generate electricity locally with solar, use electricity more efficiently with modern appliances, and shift electricity demand to low-price times with batteries and demand flexibility. Second, DERs can reshape electricity demand profiles to alleviate strain on wires, transformers, and other distribution grid infrastructure. This can avoid expensive infrastructure buildout, the costs of which utilities pass on to all ratepayers by raising prices.

DERs can reduce economic inequality. Almost everyone spends money on fossil fuels, but almost all of that money goes to a small number of fossil-fuel company owners, executives, and major shareholders. In the US, for example, the richest 1% own 50% of all corporate equities and mutual fund shares; the next-richest 9% own another 37%. The other 90% of Americans own just 13%. DERs, by contrast, are usually owned by the people whose roofs, basements, and garages the DERs occupy. In a DER-rich future, almost everyone would reap the benefits of their own energy infrastructure.

That’s my take on money and DERs: DERs present vast and growing business opportunities. DERs can also make energy more affordable, both for DER owners and for everyone who pays utility bills, while reducing economic inequality.


  1. While GDP is a widely used economic measure, it’s worth remembering that it’s a pretty bad one. GDP ignores inequality: If I make $50 trillion and the other 350 million Americans all lose $100,000, then US GDP goes up by $15 trillion. GDP ignores unpaid work: If 50 million Americans each spend 1,000 hours per year on care work and housework, then those 50 billion person-hours — worth $1 trillion if valued at $20 per hour — generate $0 in GDP. GDP rewards bad stuff: If my power plant gives you lung cancer that you spend $100,000 to treat, then GDP goes up by $100,000.
  2. These price declines are for the panels themselves, the physical rectangles. Total installed costs have fallen too, but not as steeply due to “soft costs” such as marketing, sales, permitting, installation labor, and installer profit. Some countries are better than others at reducing soft costs.

Why DERs? Part 1: Health

This is the third live-blog of my spring 2026 DERs class.

The last post discussed what Distributed Energy Resources (DERs) are: Controllable electrical devices that plug in at the edge of the power grid. The next few posts will consider why someone might want to study DERs. I think there are three main reasons: Health, money, and climate. This post will focus on health.

DERs improve health by displacing things that burn fossil fuels. Electric skateboards, bikes, scooters, wheelchairs, trains, buses, cars, and trucks displace vehicles that burn gasoline or diesel. Electric heat pumps, water heaters, clothes dryers, and induction stoves displace appliances that burn natural gas, propane, or heating oil. Solar photovoltaics displace power plants that burn natural gas or coal.

Burning fossil fuels emits air pollution that can cause a range of health problems. There are many types of air pollution, but in this context the most thoroughly studied is fine particulate matter: Tiny particles that can enter our bloodstream when we inhale them. Inhaling fine particulate matter increases risks of asthma, bronchitis, strokes, lung disease, lung cancer, heart disease, heart attacks, and premature death. Health and mortality risks from fine particulate matter are higher for children and the elderly.

A 2021 study estimated that fine particulate matter from burning fossil fuels caused 10.2 million premature deaths worldwide in 2012. That’s 18.6% of the estimated 54.8 million total human deaths in 2012.

A 2023 study estimated that fine particulate matter and ozone from burning fossil fuels caused 5.1 million avoidable deaths worldwide in 2019. That’s 8.7% of the estimated 58.4 million total human deaths in 2019.

In the United States, polluters disproportionately expose communities of color and low-income communities to fine particulate matter and other air pollutants, according to a 2021 study.

Burning fossil fuels emits air pollution that sickens and kills a lot of people. By displacing things that burn fossil fuels, DERs can avoid a lot of sickness and death.

What are DERs?

This is the second live-blog of my spring 2026 DERs class.

Distributed Energy Resources (DERs) are1 controllable electrical devices that plug in at the edge of the power grid, typically through buildings. Examples include batteries, electric vehicles, solar photovoltaics, space heating and cooling equipment, water heaters, thermal storage, and a variety of loads whose operation can be shifted through time, from dishwashers to aluminum smelters.

Image credit: DOE Loan Programs Office

DERs are different from, and complementary to, the central infrastructure that has dominated American electricity systems for the last century. A great example of what DERs aren’t is the newest coal power plant in the US: the Sandy Creek Energy Station near Waco, Texas. The plant took five years to build, came online in 2013, cost about $1.7 billion in 2026 dollars, and had nearly 1 GW of electricity generation capacity — enough to power about half a million homes — until it failed catastrophically in late 2025. It will stay offline until 2027 at the earliest. At its peak, the Sandy Creek coal power plant emitted millions of tonnes of carbon dioxide per year, was among the worst air polluters in Texas, and could only change its power output by about 5% per hour. That sluggishness prevented the plant from providing most of the fast reliability services that power grids need to operate stably 24/7/365.

Where the Sandy Creek coal power plant was slow and dirty, DERs tend to be agile and clean. A battery or heat pump (an efficient electric heating/cooling machine) might install in hours, change its operating point from zero to full capacity in seconds, and emit no greenhouse gases or air pollution if run on clean electricity. DERs can be aggregated2 and coordinated to provide a portfolio of reliability services to power grids. Unlike big central power plants, which connect to the high-voltage transmission system, DERs live at the edge of the power grid near people’s homes, businesses, and vehicles. This lets DERs provide reliability services that central power plants can’t, such as alleviating strain on low-voltage wiring and circuit breaker panels within buildings, or on power lines and transformers in medium-voltage distribution grids.

That’s a little flavor for what DERs are. Next time: Why you might want to learn about DERs.


  1. Wikipedia editors disagree. They redirect DER searches to Distributed generation, a page that mainly talks about energy supply — backup generators, solar panels, etc. — and largely ignores the other two categories of DER: energy storage and flexible demand. I have not had success trying to change this, but maybe someday.
  2. A group of DERs that coordinate to provide grid services is called a Virtual Power Plant (VPP) or a Distributed Power Plant (DPP). The idea is that a VPP done well has all the capabilities that grid operators expect from a conventional power plant, and maybe more.

Live-blogging my DERs class

This is the first live-blog of my spring 2026 DERs class.

I love the idea of writing up my thoughts as short essays, but have done little of it over the last few years. Instead, I’ve written a fair number of research papers — usually polished, dense, long, and inaccessible to non-experts — and a lot of social media posts. For whatever reason, I rarely find or make time to write stuff in the middle ground: A little longer and more formal than a post or thread on social media, but a lot shorter and less formal than a research paper.

In hopes of changing that, this year I plan to live-blog my class on Distributed Energy Resources (DERs). I have three goals:

  1. To organize my thoughts and convey the main points with minimal math.
  2. To offer students a written complement to the lectures.
  3. To share the main ideas with a broader audience.

I hope to post at least once per week. Ideally twice. In a perfect world, I’d post before lecturing, organizing my thoughts and maybe sparking new ideas or perspectives to discuss in class. That said, it’s already two weeks into the semester as I write this first post. We’ll see how it goes!

Two steps to deep decarbonization

Last month, the International Energy Agency1 (IEA) reported on what the world must do to maintain a livable climate and ensure that all people gain access to modern forms of energy such as electricity and clean cooking2. The IEA projects that the United States and other rich nations must reduce greenhouse gas emissions 80% from 2022 levels by 2035. Eighty percent in 13 years. The United States reduced emissions just 7% over the 13 years from 2009 to 2022.

Reducing emissions 80% by 2035 will not be easy, but we do have a clear strategy based on proven technologies that are economically viable today. The strategy consists of two steps, which we can implement concurrently: (1) clean up the power grid, and (2) electrify everything we can.

The animation above shows the Environmental Protection Agency’s latest estimates of United States greenhouse gas emissions. As of 2021, about 29% of United States emissions came from transportation, 25% from electricity generation, 23% from industry, 13% from residential and commercial buildings, and 10% from agriculture and other land use.

If we flipped a magic switch that converted all electricity generation to zero-emission sources, we’d reduce United States emissions by 25%.

If we flipped another switch that replaced all fossil-fueled light-duty vehicles (cars, minivans, pickups, and sport utility vehicles) with electric vehicles, we’d reduce emissions by another 16%3. If we also electrified all fossil-fueled space and water heat in our homes and businesses4, as well as all heat for low- and medium-temperature industrial processes5, we’d reduce emissions by another 20%, bringing the total reduction to 61%.

We can make these changes using existing technologies that are economically viable today: mainly wind turbines, solar panels, electric vehicles, and electric heat pumps. Other low-emission electricity sources, such as hydropower, geothermal, and nuclear fission, can play significant roles. Electricity and heat storage, as well as flexible energy demand, can promote reliability of energy supply. New power lines can carry renewable electricity from windy and sunny areas to cities.

While these transitions are feasible, they require speed and scale on par with the fastest infrastructure transitions that the United States has ever seen, such as rural electrification in the 1930s and ’40s, the Arsenal of Democracy manufacturing push in World War II, and building the interstate highway system.

It’s long past time to deploy proven technologies as fast as we possibly can. We don’t have time to wait and see if research and development efforts can make unproven technologies — like nuclear fusion or gigaton-scale carbon capture — technically feasible and economically viable. These technologies might help someday, but to echo Jigar Shah, director of the Department of Energy’s Loan Programs Office, now is the time to deploy, deploy, deploy.

What does “deploy, deploy, deploy” look like for individual Americans? It’s pretty simple, really. The next time we need to replace a car or truck, we can get an electric vehicle (or — way more fun! — an electric bike). The next time a furnace, boiler, or air conditioner needs replacement, we can get an electric heat pump. The next time a water heater or stove needs replacement, we can get a heat-pump water heater or induction stove. (The nonprofit Rewiring America publishes guides to planning home electrification projects and accessing rebates and tax breaks.) We can also install rooftop solar panels, join community solar programs, or sign up for a clean electricity plan if our utility offers one.

In addition to individual action, we need systemic change to accelerate clean-up of the power grid and electrification. We can vote, particularly in primaries and close general elections, for candidates who promise climate action. (Organizations like Climate Cabinet support candidates for state office who prioritize climate action.) Once candidates get elected, we can push them to deliver on their promises of climate action. We can do this alone, through office visits, phone calls, letters, social media, or email. Better yet, we can join groups that organize collective action. We can also divest our savings, if any, from banks that fund fossil fuel companies. (Marilyn Waite, the managing director of the Climate Finance Fund, maintains a list of sustainable banking and investment options.)

The parallel two-step strategy of cleaning up the power grid and electrifying everything we can will not, on its own, deliver all of the emission cuts that we need. But this strategy will go a long way toward deep decarbonization — 61% is not so far from 80% — and we can implement it using existing technologies that are economically viable today. To borrow a phrase from the IEA report, “the fierce urgency of now” requires it.


  1. Per Wikipedia, the IEA is an intergovernmental organization with 31 member countries and 13 associate countries, who collectively use 75% of global energy. ↩︎
  2. From Chapter 2 of the IEA report, about 35% of the world’s eight billion people currently lack access to electricity, clean cooking, or both. ↩︎
  3. The EPA estimates that 58% of transportation-sector emissions come from passenger-cars (21%) and light-duty trucks (37%), which include minivans, pickups, and SUVs. ↩︎
  4. The US Energy Information Administration estimates that 93% of fossil fuels burned in residential buildings go to heat space or water. Similarly, the IEA estimates (see Tables C1, E8, and E10) that space and water heat comprise 79% of fossil fuel burning in commercial buildings. Combining the residential and commercial numbers based on fossil fuel use in each sector, space and water heat comprise an estimated 89% of fossil fuel use in buildings. ↩︎
  5. A recent report on industrial electrification estimates that 13% of fossil fuel use in industry is in conventional boilers and another 21% is for process heat below 300 °C. ↩︎

FAQ: Publishing research papers

I intend this guide for grad students in my engineering research group. Some of the recommendations apply broadly, but others are specific to me or my field.

Why should I publish research papers?

Most researchers hope their work improves the real world in some tangible way. Publishing doesn’t guarantee that, but it helps.

Publishing also helps students get jobs in academia and research labs, and helps professors get tenure and promotions.

How many papers should I publish?

For most purposes, the more the better.

In my field, professors typically expect one good first-author journal paper for a master’s degree and three for a PhD. Conference papers and non-first-author journal papers usually don’t count.

Who decides whether my paper gets published?

Editors and peer reviewers.

A submitted journal paper goes to an editor, who screens it for perceived quality and relevance to the journal’s scope. If the paper passes that check, the editor sends it to one or more peer reviewers. Reviewers read the paper, or at least skim it, and score its originality, correctness, and impact. Reviewers submit scores to the editor, who decides whether to reject the paper, accept it conditioned on revisions, or accept it as is.

Most conferences work similarly.

What makes a paper publishable?

Publishable papers are papers that editors and reviewers believe are original, correct, and impactful.

Some people think that doing a lot of work entitles them to publication. Others think that papers that are easy to write must be unpublishable. Neither view is accurate.

How do I show originality?

Original papers create new ideas, theorems, methods, algorithms, data, statistics, software, or physical objects. To convince editors and reviewers of originality, authors should (a) show that they understand related work, and (b) state several creations in their paper that don’t exist in related work. Each of those creations is a contribution.

When trying to show originality, authors sometimes dismiss or deride related papers. I don’t recommend this. The authors of those papers may be your reviewers. Also, it’s rude.

How do I show correctness?

In theory, a paper should demonstrate inarguably that its contributions are correct.

In practice, editors and reviewers rarely have time to check this. Instead, they check things they view as stand-ins for correctness. Authors can improve their odds of passing correctness checks by using good grammar, spelling, and logic; showing that they understand related work; clearly explaining all methods; using standard, consistent mathematical notation; defining all symbols; making figures easy to understand; and sharing all data and code necessary to validate their contributions.

How do I show impact?

Explain how the contributions could tangibly improve the real world.

Which individuals, businesses, or government bodies could use the contributions? How could the contributions change behavior, products, or policies? What improvements to the real world could those changes cause? How large could those improvements be? Who could benefit?

For example, suppose you create a control algorithm that improves air conditioner efficiency by 15%. Manufacturers could add your control algorithm to their air conditioners. A typical family could save $75 per year on energy bills. Communities near power plants could breathe less air pollution and suffer less respiratory illness. The world could emit 1% less greenhouse gas pollution, slow climate change slightly, and inflict less suffering on disadvantaged people.

Where should I focus my efforts?

The title, abstract, figures, and statement of contributions.

Few people who interact with your paper will reach the main body of text, as the figure below illustrates. You can increase the number of people who actually read the paper by (a) publishing in a good journal, which increases the number of potential readers; and (b) shaping the title, abstract, and figures to draw in potential readers.

Better journals get more readers. Readers are busy and the world is full of bad papers. Good journals save readers time by filtering out bad papers. Publishing in a good journal requires a convincing statement of contributions; see “How do I show originality?”

My favorite kind of title states the paper’s best contribution in a simple sentence. My least favorite titles use acronyms and jargon. Some good titles ask provocative questions, which the abstracts answer.

A good abstract gives away the whole paper. It tells readers why they should care about the topic, what past work has shown, what contributions the paper makes, and how the contributions could tangibly improve the real world.

Figures should make sense to people who’ve only read the title and abstract. Legends and axis labels should use words, not acronyms or symbols. Text in figures should be about as big as text in the body. Each figure should convey one key message. Any element of a figure that doesn’t help convey the figure’s key message should be cut. Most figures should showcase the paper’s contributions — typically with one or two figures or tables per contribution — but a couple of figures can illustrate the problem or methods.

As I write the body of a paper, I periodically stop and read it out loud. Can I audibly say the words I wrote without confusing myself, cringing at the sound of my own voice, or boring myself to sleep? I find this almost a necessary and sufficient condition for decent writing.

A few style tips:

  • Shorten words, sentences, paragraphs, papers. To respect busy readers, get to the point.
  • Use mostly active voice (“Fig. 3 shows…”), not passive (“It can be seen from Fig. 3 that…”).
  • Delete most adjectives. Let readers decide for themselves if a result is “impressive” or an idea is “innovative.”
  • Restrict each paragraph to one main idea, encapsulated in its first sentence.
  • Use few or no acronyms. Readers jump around papers; an acronym defined on page three may alienate a reader who jumps from page one to six.
  • Spell out the integers zero through nine and any number that starts a sentence. Write all other numbers as numerals (12, -3, 2.718, etc.).

Dense housing is sneakily good for the climate

Using energy in homes causes 16% of United States greenhouse gas emissions1 and costs Americans $230 billion each year. About half of those emissions and costs come from heating and cooling homes.

We can reduce emissions and costs from heating and cooling in several familiar ways. We can keep our homes cooler in winter and warmer in summer. We can choose milder thermostat settings when we go to bed or leave home2. Homeowners can invest in insulation, air sealing, good windows, and efficient heating and cooling equipment. Governments can pass codes that make landlords to do the same.

But there’s another, less familiar way to reduce demand for heat and cooling: Living in dense housing.

Homes in dense buildings (such as apartments, row houses, and condos) share walls with adjacent units, so have less wall area facing the outdoors. That means less heat lost to the outdoors and less heat needed from the furnace, boiler, or heat pump.

This “save energy by sharing surfaces” effect is why my cats used to get so snuggly on cold days. They lost no heat through whatever parts of their bodies they could get into contact with each other. Similarly, an apartment loses little heat through walls it shares with other units.

Sharing walls can save surprising amounts of energy. As the figure below shows, a stand-alone house has twice as much exterior wall area as a unit with the same floor area in a four-unit multi-family building. That means the multi-family unit needs about half the heat in winter and half the cooling in summer. Half the demand, half the emissions, half the costs.

Data from the Energy Information Administration’s Residential Energy Consumption Survey support this theory. On average over the United States, detached single-family houses use about 19 thousand BTU per square foot per year for space heating3. Apartments in buildings with five or more units use about 10 thousand BTU per square foot per year4. Half the demand, half the emissions, half the costs.

Cutting a house’s heat demand in half through renovations – such as insulating, air-sealing, and replacing windows and heating equipment – is very difficult. While energy-efficiency renovations of that depth are possible, they often take years and cost tens of thousands of dollars.

Dense homes can have other benefits. They tend to be in dense neighborhoods, where people can get to friends, food, and fun without driving. Driving less reduces emissions, fuel costs, traffic, and the number of people that car crashes injure or kill. Dense homes also tend to use space more effectively than stand-alone houses, letting residents live comfortably in less space. This can further reduce demand for heat and cooling.


  1. According to the EIA, residential and commercial buildings caused 29% of US greenhouse gas emissions in 2022, including indirect emissions due to electricity use. Buildings also used 40% of final energy (22% residential, 18% commercial). Allocating emissions between the residential and commercial sectors in proportion to their energy use gives a residential emissions estimate of 0.29*0.22/0.4 = 0.16, or 16%. ↩︎
  2. Shameless plug: My research group works on ways to automate thermostat adjustments to reduce demand for heat and cooling, improve equipment efficiency, and keep occupants comfortable. ↩︎
  3. The average US single-family home has 2,264 square feet of floor area and uses 44.0 million BTU per year for space heating. ↩︎
  4. The average US apartment in a building with five or more units has 905 square feet of floor area and uses 9.1 million BTU per year for space heating. ↩︎

Purdue University and Indigenous people

Purdue’s campus occupies traditional homelands of the Bodéwadmik (Potawatomi), Lenape (Delaware), Myaamia (Miami), and Shawnee peoples, who are the original Indigenous caretakers of the land.

White settlers forced most Indigenous people out of Indiana after the federal government passed the Indian Removal Act of 1830. In 1838, for example, Indiana’s governor ordered a militia to burn a Potawatomi village, home to 859 people, and march them at gunpoint to a reservation in Kansas. In this forced removal, called the Potawatomi Trail of Death, militia members killed 28 children and 14 adults.

Purdue is also a land-grant university. In 1865, the federal government gave the state of Indiana 380,000 acres of land, spread across states ranging from Michigan to Montana. The U.S. had taken that land from Indigenous people by treaty, coercion, or violence. Per the Morrill Land-Grant Act of 1862, this gift of Indigenous land came with the obligation to establish a university teaching agriculture, the mechanical arts, and military tactics.

The state of Indiana sold the gifted Indigenous land and used the proceeds to endow Purdue with $340,000 in 1874. Adjusted for inflation and assuming investment at a 4% annual rate of return, $340,000 in 1874 translates to about $3 billion in 2023. Purdue’s total endowment is currently $3.7 billion.

This High Country News article and the associated data repository have more information on the history of land-grant universities and Indigenous peoples.

Purdue’s Native American Educational and Cultural Center supports students from Indigenous backgrounds, who currently make up about 0.2% of the student body.

Wind and solar costs have plummeted

Wind and solar power are now among the least-cost options for new electricity generation. The following figure, from Lazard’s 2023 report,  shows the current unsubsidized levelized cost of energy (LCOE) for various sources in the United States. LCOE is the ratio of all lifetime (discounted) costs to lifetime energy production. The unsubsidized LCOEs of utility-scale solar and onshore wind (circled) are now at or below the LCOEs of all conventional power plants (bottom four rows), including natural gas combined cycle.

Since 2009, wind and solar costs have declined by about 66% and 84%, respectively. The following plots, also from Lazard’s 2023 report, show the unsubsidized LCOEs of onshore wind (top) and utility-scale solar (bottom) in the United States from 2009 to 2023.

These cost declines are incredible success stories of research, development and deployment. They have made clean, renewable power the least-cost option in many settings. This new alignment of incentives between cutting emissions and making money has made wind and solar power two of the largest sources of new electricity generation capacity in the United States, as this Canary Media chart of 2023 capacity additions shows.

We’re harming each other via the climate

The Intergovernmental Panel on Climate Change (IPCC), a United Nations group that synthesizes climate science, issued its latest report in August, 2021. This report reiterates what we’ve known for many decades: human activities, especially burning fossil fuels, are heating the planet. But the report also summarizes recent advances in attribution science, which show how human-caused heating is increasing the frequency and severity of heat waves, droughts, floods, storms, hurricanes, and wildfires.

These natural disasters are causing real harm to people. In the United States, for example, the National Oceanic and Atmospheric Administration has tracked natural disasters since 1980. The following graph, from their 2021 Billion-Dollar Weather and Climate Disasters report, shows the numbers and costs of natural disasters in the United States that caused more than $1 billion in damages (inflation-adjusted to 2021 dollars). The bars in this graph are the numbers of billion-dollar disasters each year. The curves show the annual costs of these disasters (brown, with the 95% confidence intervals shaded in gray) and the five-year moving average of these costs (black).

The striking message of this graph is that natural disasters in the United States are becoming more frequent and severe. In the last five years, these disasters have cost about $640 billion and killed about 4,000 people. While not all of these natural disasters can be attributed to climate change, we now know that human-caused heating is increasing their frequency and severity.

If we don’t act quickly to cut greenhouse gas emissions, we will likely see more, worse natural disasters in the coming decades. According to the IPCC’s report on climate impacts, we should also expect to see more poverty, reduced crop yields, more water scarcity, higher rates of food- and water-borne diseases, and rising seas submerging coastal communities. These factors are likely to drive millions of people from their homes and increase risks of violent conflict. The impacts will disproportionately harm vulnerable people, in both developing and developed countries.

For me, climate action is fundamentally about reducing human suffering: poverty, hunger, thirst, disease, displacement, injury, and death. To reduce that suffering, we can and must slow climate change and prepare for those impacts of climate change that we can no longer avoid.